DSO Familiarization
Activities
It is assumed that you have read the introduction and
completed the Pre-Lab Quiz
If you have not done so, read the
introduction before continuing.
Now that you have read the introduction, it is time to become familiar with
the DSO.
After each step turn the 'Soft Menu' Off unless instructed to
leave it on.
- Turn on the ac power to the DSO.
- Connect a cable to the Channel 1 input connector.
- Set you scope for Channel 1 only (if necessary, turn it on, or turn off
Channel 2)
- Set your Channel 1 Volt per Division to 100 mV/div.
- Set your Time per Division to 5 milliseconds per division.
- Set your Trigger Level to 0 V by pressing in on the 'Trigger' knob until
it 'click's and then release.
- Record in your notebook what you observe in the following cases:
(Explain what you did and what you observe - i.e. 'With the ends clipped
together, I ...')
- The two ends of the cable clipped together.
- The two ends not touching - you or anything metallic.
- Your finger touches the metal part of the red clip.
- Repeat a), b), and c) after changing the V/div to 1.00 V/div.
- Set your Volts per Division to 1V per division and your Time per
Division to 1 millisecond per division.
- Set your 'Coupling' to 'GND'
and adjust your vertical position until the trace is along the middle line
of the grid. This sets the center line to be 0 V. (A short
cut to this is to press and release the Ch. 1 position knob.)
- Set your Channel 1 Coupling to 'DC'. You have a battery in a
plastic holder with two metal clips. Place your black clip on the
negative side of the battery.
- Touch your red wire to the positive
terminal of the battery. Record your observations.
- Move the black lead to the positive end of
the battery and repeat.
- Set your Channel 1 'Coupling' to 'AC' and
repeat the previous two tests. What do you conclude that AC coupling does?
- Switch the TIME/DIV control to 100ms. Set your trigger level to zero by
pressing and releasing the 'Trigger Level' knob. You should now be seeing a
line sweep slowly across the screen taking about a second to go across once
(each division is covered in 0.1 seconds.)
Connect your Channel 1 leads to the solenoid provided. Generate a voltage in
the coil by moving a bar magnet in and out of the coil. Observe the signal
on the oscilloscope. You may need to reduce the Volts/Div control. Describe
the appearance of the trace. How large a voltage can you generate? What
determines the size of the voltage?
- Connect the black or bare clip to the leftmost of the two metal
protrusions just below the round 'Print' button - there is a symbol that
looks a bit like a rake beside it. Connect the red clip to the
remaining metal protrusion. (hint: set your time/div to about
2 ms/div as a starting point)
- Describe what you observe.
- Set your trigger level to approximately one-third of the height of
the waveform. Does the displayed wave change? If so, how?
- Set your trigger level so that it is above the top of waveform.
Does the displayed wave change? If so, how?
- Adjust your Time per Division until you have a waveform that 1
period occupies more than 4 horizontal divisions and measure the period
in divisions.
- Use your Time per Division value to calculate the period in seconds
and the frequency in Hertz.
- Decrease the Channel 1 Volts per division value until you have the
tallest waveform that will fit on the screen vertically. (You may have to
adjust the vertical position of the trace in the process).
- Place the lower portion of the trace on a grid line. Use the Horizontal Position knob to shift the waveform until the upper
part crosses across the vertical center line.
- Measure the peak-to-peak amplitude in Divisions.
- Use the Volts per Division value to calculate the peak-to-peak
voltage. Now you have measured DV
between the top and bottom parts of the waveform, but you still don't
know the actual voltages. For instance, if you measure 10V peak to peak,
the bottom might be 5V and the top 15V or the bottom could be -5V and
the top 5V. Often knowing DV
is all we need, but not always.
- To know the actual voltages we need to determine where the 0V
reference is. Press the green 'CH1' button,
push the 'Soft Key' to the right of 'Coupling', rotate the selection knob to
'GND' and press the 'Soft Key'' again. Adjust the Vertical
Position for Channel 1 until the line is centered on the grid line one
division above the bottom of the screen to set that line as 0V. Set the Channel 1 Coupling to 'DC'.
What are the voltages of the top and bottom portion of the signal?
- Use GND Coupling again to move the zero volt location back to the center
line. Go back to DC Coupling. - If needed, adjust your Volt per division
until the entire waveform is on the screen. Change the Coupling to AC.
Describe what happened. Is this consistent with what you saw in step
10?
- Before moving on to using both Channels, let's try one more thing. Remove the clip connecting the black or bare wire to the left metal
protrusion. How does the display change? Why do you think
this is the case?
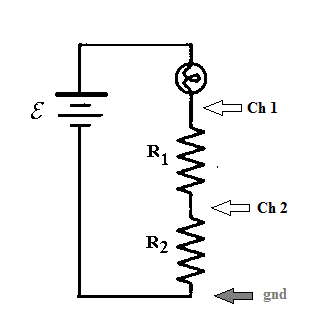
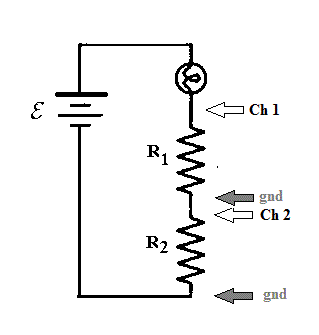
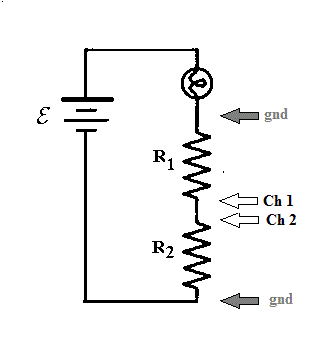
- Connect your battery, lamp, and two resistors as shown in the figures
below. You will connecting both channels to the circuit, so make sure
that Channel 2 is active. Both should be set to 500 mV/div for a
starting point.
- Connect your scope as in 'A' and record your values. Compute and
record the voltage across R1. Comment on the lamp brightness (if any).
- Change your connections to those shown in 'B' and record your values.
Comment on the lamp brightness (if any).
- Change your connections to those shown in 'C' and record your values.
Comment on the lamp brightness (if any).
- If the lamp glowed in a, b, or c, explain how this is possible since the
values of the resistors are so high that not enough current can pass through
the lamp to make it glow with the DSO disconnected.
- Turn off Channel 2.
Write a few sentences about what you observed in the tests.
Familiarization with the Function Generator
The next steps will give you some familiarity with the
function generator that is built into the B&K Precision 2540-B DSO.
- Remove your test lead cable from the Channel 1 BNC Jack. Attach
the ~ 20 cm long cable between the Channel 1 input and the Function
Generator output.
We want to set the function generator for a sine wave of a specific amplitude
and frequency - in this case 2.00 V peak-to-peak and 1822 kHz.
- With the experience you have adjusting the Volts per Div and the Time
per Div, you should have a feel for how the DSOs menus work by now.
The only new thing is using the 'Multi-Select' knob to pick a value and the
< > switch below it to move one digit to the left or right. The item
to be changed by the 'Multi-Select' knob will be in red. A 'Press and
Release' of the 'Multi-Select' will enter your value. Set the frequency and
amplitude to the values given above before proceeding.
- Press the 'ON/OFF' button and it should turn green. You will have
a display on your screen that will require changing your Time per Div and
possibly your Volt per Div. Use these adjustments to find a display
that covers more than 3 division from peak-to-peak and more than 4 divisions
for 1 period.
- Record your Volts/Div, Time/Div, # of Div peak-to-peak, and # of Div
in the period.
- Compute your peak-to-peak voltage and your frequency in Hz and
compare it to the value you set. Calculate the percent error in
the Amplitude and the frequency.
Now we will let the DSO measure the same quantities for us. Press
the 'Measure' button. Press the 'Soft Key' by 'Source' until Ch 1 is
visible. Press the 'Voltage' 'Soft Key', and a number of possible
voltage measurements will be shown. Choose the peak-to-peak voltage by
pressing its 'Soft Key'. The value will be shown in yellow near the
bottom of the display.
- Record the value in your notebook and compare it to the value you
measured using the grid with the divisions.
Next we will have the DSO measure the RMS value of the voltage. Choose 'Voltage' from the 'Measurement' 'Soft Menu' and choose the Vrms value. Hide the menu.
- Record your value and compare the the Vrms value you would expect
for a sine wave. (hint Vp = 1.414 Vrms)
Next we will determine the frequency of the sine wave. On the
measurement 'Soft Menu' select 'Time' and then 'Period'. You might
have to hide the menu to read the value in yellow for Channel 1 at the
bottom of your display.
- Record this value, convert to a frequency and compare the set
frequency, frequency measured by the DSO, and the frequency that you
measured.
Go back to the Function generator and choose a frequency near 1 kHz.
Change Output to 'Built In - Arb', then go down to Waveform and select one
of the many options.
Set your Amplitude to 1 Vrms (use the function generator - the relationship
between Vp and Vrms will be different than for a sine
function). Adjust your Time / Div until two periods
are shown. Adjust your Volts / Div until the trace is more than 3
divisions tall peak-to-peak.
- Make a careful sketch in your lab notebook of the waveform
displayed. Be sure to include your Volts / Div and Time / Div
values.
Turn the Function Generator output off, and turn off the DSO.
Be sure to include a conclusion where you reflect on what you have learned
today.
last modified 19 April, 2017


