Joule is given credit for determining the mechanical equivalent of heat. His experiment
performed mechanical work on a container of water in such a way that all of the work was converted
into heat by friction. The temperature of the liquid was measured as work was done on the
system by friction forces on falling masses, and Joule discovered that the temperature increased
just as if heat had been added to the system.
Rather than repeat Joule's effort by converting mechanical energy into heat, we will test whether the energy in a flowing electrical current causes a similar response. To do this we will compare the experimental and approximate theoretical values of the heat capacity of the system. The system consists of the inner calorimeter cup and the water it contains. (We will ignore the heat capacity of the stirring bar and the electric heater.) The amount of heat needed to raise the temperature of the water and the system by 1.0oC is called the heat capacity.
The raw data will be the temperature of the calorimeter versus time.
The electrical power multiplied by the time gives the electrical energy.
As we will learn later in class, the electrical power due to a flowing
electrical current is given by:
P = I V, where I is the current in Amperes and V
is the voltage in volts. By measuring both I and V, we can determine the average
input power. In order to get the energy supplied, it is necessary to multiply
the average power by the elapsed time. One data point will be taken every 2.5
seconds for 20 minutes. The resulting 480 points will be plotted to determine
the heat capacity of the calorimeter cup. Other than the
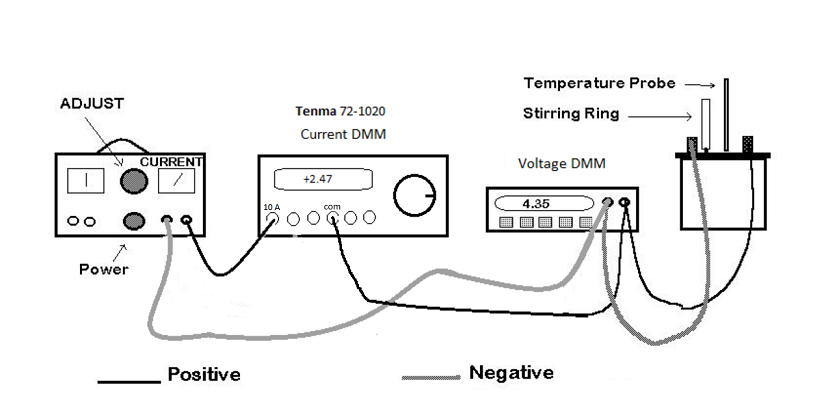
thermometer, the apparatus needed to perform this experiment is shown in the following
diagram:
The power supply is controlled by the lower knob. Be especially careful to only use the 0-12 V DC range. Also make sure that the larger upper control knob is set to its minimum (i.e. fully counter clockwise) before turning on the power. The wiring connections shown in the diagram should be followed. The initial current will be roughly measured by the analog meter on the power supply (i.e. the needle's position on the scale). Once the experiment is underway, the values of voltage and current used to calculate the power will be measured by two Digital Multi Meters. ( A multi meter is capable of measuring several electrical properties - but only one at a time.) You can choose either current or voltage measurement by pressing a button. Hence, the term "multi meter"). Notice that the Tenma DMM (which is used to measure the current) is connected to the power supply and then connects on to the rest of the circuit. Thus all current through the circuit is measured by the Tenma DMM. The other DMM, which is used as a voltmeter, has both leads connected to the calorimeter. The Voltage DMM should be set to DC Volts (and 20 V maximum if it is not a Metex). The Tenma DMM must be set to measure current by turning the rotary knob if necessary.
The Tenma is a sophisticated meter, and it requires a bit of setup before it can be used. Its AC power switch is on the back. Go ahead and turn it on. Refer to the figure below. The small pushbutton by the right-pointing arrow on the lower right side must be depressed. The value read by the meter will be shown in the large digits (in this case 0.954A). With power supply off, this value should be near zero. You should see "AC+DC True RMS" above the current reading. If you do not push the 'SELECT' button indicated by the downward-pointing arrow on the left hand side. Once the meter says "AC+DC True RMS", the Tenma is ready for use. (The upward pointing arrows in the picture identify where the wires go to the Tenma).
.png)
Notice the stirring rod in the diagram. It
lifts a metal ring in the cup and is used
to gently stir the water so the entire cup is at the same temperature while data is being
taken. The stirring rod handle is lifted vertically until resistance is felt and
then allowed to come back to its equilibrium position. If you want good results, it is essential that you stir gently and consistently for
the entire twenty minutes - in shifts maybe? Once you have your experiment set up,
ask your instructor to verify the connections before proceeding.
Start LOGGER PRO, by double clicking JouleHeat.cmbl.
Check the calibration of your temperature probe by placing the liquid-in-glass thermometer next to the temperature probe. Start a collection and take a few points. Confirm that the temperature measured by Logger Pro is approximately the same as that measured by the thermometer. If there are significant differences, tell your instructor.
Measure the mass of the inner calorimeter cup when dry and empty.
Place the inner cup in the calorimeter and replace the cover. Measure the mass of the entire empty calorimeter.
Place room temperature water, from a container on the back bench, in the inner cup until it will just barely cover the coil of heater wire. (Do not use water from the faucet!) Place the heater in the inner cup, then remove it and check to see if the entire coil of wire is wet. If not add water in small amounts until the heating coil is just covered.
Measure the mass of the entire calorimeter plus water.
Return the calorimeter to the desktop and attach the wires to the calorimeter. Insert the temperature probe through the 1-hole stopper and place in the center of the calorimeter. The probe should not touch the bottom of the cup.
After checking to see that the power adjust knob is fully counterclockwise, turn on the power supply.
Start Logger taking data. When "STOP" appears, quickly and smoothly advance the adjust knob on the power supply until a current of between 3 and 4.5 A is observed on the rightmost (current) meter on the power supply.
Check that the voltage DMM is indicating a value less than 6.0 V, and start gently stirring your water by smoothly lifting the stirring ring up and down. The computer will tell you the most recent point at the bottom of the screen and will plot a graph of temperature versus time.
While stirring, have a group member monitor the values of the voltage and current and note any fluctuations - these values should be relatively stable.
Once a minute, record the current and voltage in a table in your notebook (i.e. the numbers displayed on the two DMMs)
Once the experiment is over, return the power knob to its fully counter clockwise position, and turn off the power supply and the DMMs.
Again measure the mass of the calorimeter. Is there still the same amount of water in the cup?
Calculate the average current and voltage from the values you have recorded. You will need the average electrical power later so go ahead and calculate it now. The power is the product of the average value of the current (in Amperes) multiplied by the average value voltage (in volts).
Save your data on the computer desktop as a 'Graphical Analysis' (i.e. .ga3) file. Now if something disastrous happens while trying to analyze your data, you can just call it back.
The heat capacity, C, of an object is the amount of energy that must be added in order to raise the temperature of an object by 1 degree Celsius. Thus, on a graph of Energy Added (i.e. Q) versus Temperature T will be the slope of your graph. If the electrical energy added to the heater wire by the current is indeed equal to the heat added to the water, we can use the electrical power to find heat. You know from last semester that power is the rate of adding energy, so the power multiplied by the time is the energy added.
Logger Pro can create a new column of data from an existing column. Hence the times can be used to create a column of energy values by the following steps:
Now you are ready to analyze your data. Notice that we said we need a graph of Energy Added vs. Temperature in order for the slope to be the heat capacity, C, of the system. The graph you just displayed has the axes reversed. Logger Pro allows you to easily swap the columns by repeating the process in step 5 above. Make sure that you have a plot of EA vs. T before continuing.
If your entire graph appears straight click on "Analyze", " Linear Fit", to choose the linear fit.
If the data points don't form a continuous straight line, select a straight portion by dragging the mouse over the region that looks straight. The highlighted region will be inverse video (mostly grey). Now when you do a fit, only this portion of the data will be used.
Be sure to record the equation of your best line in your notebook - rounding an results to 4 SF max. The slope of your line is your Experimental Heat Capacity.
Next we want to calculate the theoretical value for the
heat capacity, assuming no heat is lost to the surroundings, which is given by:
![]()
Note: in class we used the specific heat capacity, c, which is the heat capacity of 1 gram of material. Capital C in the equation above is the heat capacity of the system. It is the sum of the heat capacity of each part of the system. The system consists of the calorimeter cup and the water that it contains. From your mass measurements, determine the mass of the water, then determine the theoretical heat capacity as given above. Show your calculations for the theoretical heat capacity in your notebook. (Be sure to use the same units for the heat capacity of water and the aluminum cup).
Compare the experimental value to your theoretical value of the heat capacity. If the two values of C agree to within experimental error, then the mechanical equivalent of electrical energy has been established experimentally. Comment on the level of agreement. If the discrepancy is rather large - like a factor of 4.2, be sure to consider the units that you have used in your theoretical calculations. The energy data on your energy vs. temperature graph is in SI units.
Reflect upon the experiment and its outcome before writing your Summary/Conclusion. Remove all of the wires and neatly organize them, close Logger Pro, empty the calorimeter's inner cup, and place any wet items on a paper towel to dry before leaving.